Uncovering Patterns in Heart Disease Data
I developed an ML model to predict heart disease using health metrics, focusing on correlations between gender, chest pain type, and blood pressure. The goal was to contribute to early detection and personalized healthcare interventions through data-driven insights
Dataset used: https://lnkd.in/gUQAgvE7
Common trends of Heart Disease
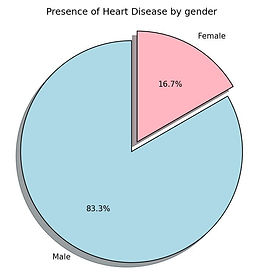
This project provided valuable insights into trends related to heart disease. Firstly, the dataset indicates that males are more susceptible, with nearly 84% of the patients diagnosed with heart disease being male. This can be explained by multiple factors, including lifestyle choices, hormonal influences, and body fat distribution.
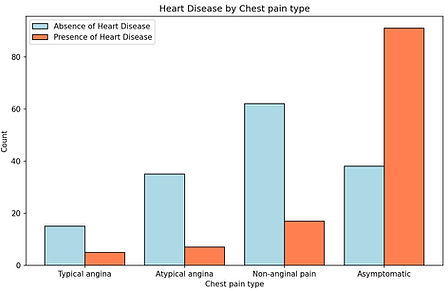
In relation to chest pain types, patients exhibiting asymptomatic chest pain are more susceptible to heart disease, with a risk increase of over 70%. In contrast, patients experiencing typical, atypical, or non-anginal pain tend to show a lower incidence of heart disease, despite being recorded at higher frequencies.
Asymptomatic chest pain may indicate underlying heart issues that go unnoticed, allowing the condition to progress without detection.
Patients with typical, atypical, or non-anginal pain may be more likely to seek medical attention and receive timely treatment, which can lead to earlier intervention and better outcomes.
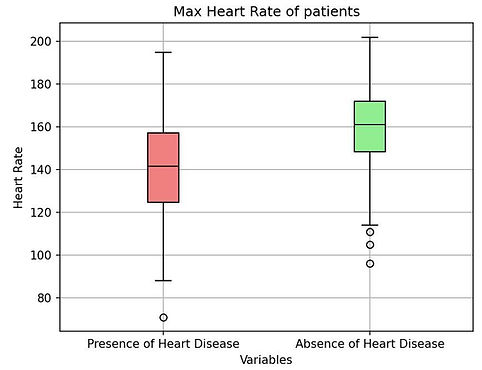
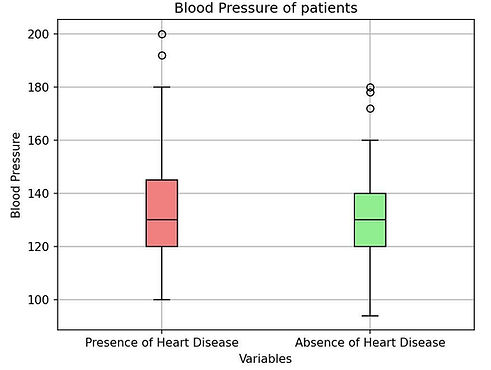
The graphs above dive deeper into analyzing the heart rate and blood pressure of patients within the dataset, and the following insights were recovered.
The median heart rate is around 140 bpm, with most values between 120 and 160 bpm. There are a few outliers below 100 bpm. On the other hand, patients with an absence of heart disease presented a median heart rate of around 160 bpm, and the range of heart rates is wider, ranging from 100 to 180 bpm.
Patients without heart disease tend to have higher maximum heart rates. These trends can be explained by the fact that individuals with heart disease might have limitations in achieving high heart rates due to weakened heart function.
As for the blood pressure of patients. Patients with heart diseases presented a median blood pressure of around 140 mmHg, with most values between 120 and 160 mmHg. There are some outliers above 180 mmHg. As for those with no heart disease, the median blood pressure is lower, around 120 mmHg, and the range is narrower, between 100 and 140 mmHg.
Patients with heart disease generally show higher blood pressure. This aligns with the well-established link between hypertension and heart disease. Elevated blood pressure strains the heart and arteries, contributing to heart disease development over time. Individuals without heart disease tend to have a more controlled or healthier range of blood pressure values.
Conclusion and Evaluation
In conclusion, one of the advantages of being a data analyst is the versatility to work across various fields and industries, using data to uncover insights regardless of domain complexity. The accessibility of data makes this possible, with businesses relying on data scientists and analysts to gather, organize, and analyze information to drive actionable insights.
To broaden my expertise, I ventured into the medical field. Despite my initial reluctance toward biology, I embraced the challenge and built a foundational understanding of medical concepts, enabling me to interpret healthcare data effectively.
This project allowed me to grasp key domain terminology and apply it within a real-world context. I successfully identified clear trends from my data, visualized them, and derived meaningful insights relevant to the medical field. I look forward to learning more about this industry and exploring the application of data analytics within the vast field of medical science.